

11 Aug What Are The Measures Of Central Tendency
The concept of central tendency is first introduced to Singapore students taking mathematics in secondary school. For many, this theorem is of great interest as it is apparent how it influences the way we see the world. Equally of interest is that it is widely used in a multitude of tertiary education courses and real-life careers.
What is central tendency, what preceded it and how is it used in everyday life? In this article, we will be exploring all 3 of these questions.
What is Central Tendency
The “measures of central tendency” is a mathematical concept under the branch of mathematics known as statistics. In the simplest of terms, it attempts to find a single value that best represents an entire distribution of scores.
In doing so, concepts of “average value”, “mid-point” and “most common value” are used in an effort to represent the distribution. Students will find these descriptions familiar as they are descriptive forms of the measures known as “mean”, “median” and “mode”.
The Importance of Central Tendency

At its core, mathematics and statistics is a language. When we have a range of results, we require an efficient manner to communicate it to others. Rather than listing every single score in the population, a “summarised version” would be preferred. This is why having a single value to present the distribution is required and easier to comprehend. These same measures can then be used to make estimations and efficiently work on a population.
Early History of Average Values
Historical stories and recounts have featured efforts by people of that time to perform estimation. In doing so, they relied on intuitively finding a measure of centre. Here are 2 examples that have been recorded.
The Athenians’ Wall Conquest
In Greek history, records of the Athenians have shown them using a form of estimation to climb over their enemies’ fortress walls. To get into the forts of their enemies, Athenians would construct ladders with sufficient height to reach the top of their walls. However, to find the right height, they had their men count the number of bricks in a column of a wall.

Naturally, given the conditions, they returned with many different answers. While naturally some was wrong, it was accepted that the majority had to be right. In this case, we can see an implicit use of “mode”. The Athenians assumed that the most frequent value had to be correct. This was true even if none of the values represented more than half of the men.
The Greeks’ Estimation of Sailors
Referring again to an account from the Greeks, who this time were attempting to count the number of sailors in their fleet. This was done by taking the known largest and smallest ship sailor numbers before finding the average and multiplying it by the number of ships.
The Greeks assumed that the size of ship crews would be fairly evenly spread out between the smallest and largest. Furthermore, it did not matter that the average was not a whole number. In this case, we can see an implicit use of the “arithmetic mean”. Rather than any observable value to represent the distribution, the Greeks used a purely derived number as the average.
Before the Measures of Central Tendency were Formalised
Given the early usage of similar methods to that of Central Tendency, you can be forgiven for wondering what is its true value. To help illustrate this, let us have a look at statements provided by many students when asked: “what is the average?”
- You look between the highest and lowest values
- The most common
- The midpoint
- The half
Yet again, from these responses, we can see that we all have an inkling of what the representation of a distribution should be. We can also acknowledge that there is no one true way of determining the ideal representation.
The Value in Central Tendency
Since there are multiple ways to determine the average and make inferences from it, how then do we choose which to use? This is where Central Tendency is needed. By recognising the patterns of distributions as well as the characteristics of each measure, we can select the most appropriate measure to be used.
As we introduce the different measures of Central Tendency, it is important to bear in mind the objective. This is to find a measure that is representative of the average of the distribution.
Mode
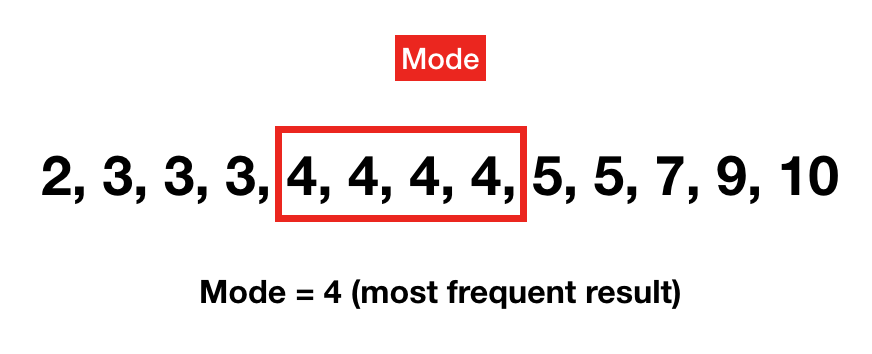
The mode as illustrated by the Greeks in our earlier example, is simply the most frequently occurring score.
The advantages of using mode include:
- Mode is the easiest to determine. An example of its application is in surveys with multiple choice questions. The answer that is most commonly chosen is taken to be representative of the population.
- You would be choosing the majority, which does intuitively give you value as an estimate.
The disadvantages of using mode include:
- The mode is not unique. It has a possibility of multiple equally frequent scores with no way to differentiate them. For example, when looking at the time taken to travel to school. It is possible that the timings of 1 hour and half an hour respectively could be most commonly reported scores, and that an equal number of students require these durations.
- Relies on frequency of scores. In the case of continuous data such as the wind speed in an area, there is a high possibility of no repeated scores. In which case, the mode cannot be determined.
Median
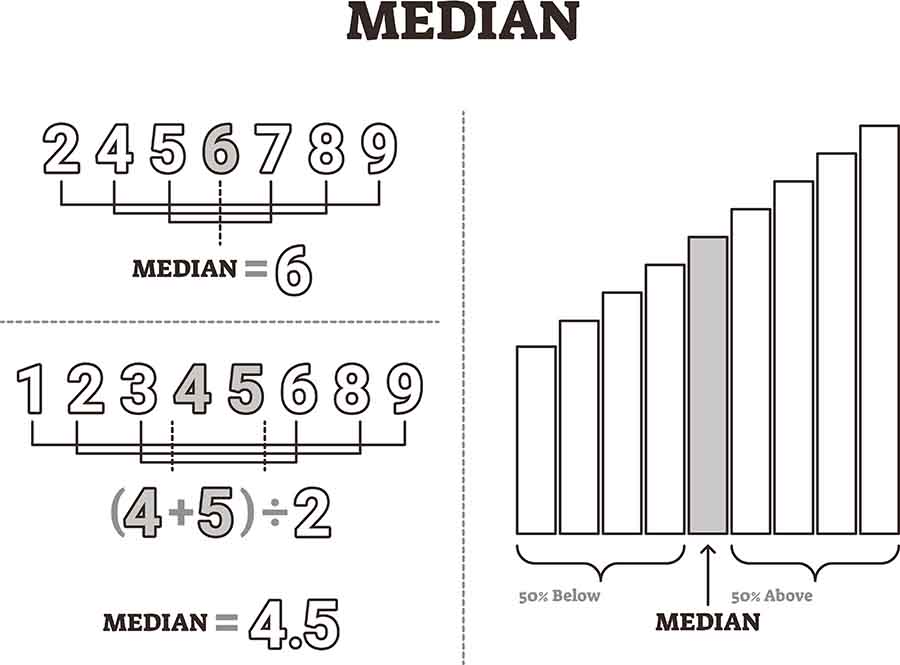
Described as the mid-point, the meridian divides a distribution in half. This means that half of the scores will be less than the median while the other 50% will be above it. Based on this concept, we can see how a distribution with an odd number of data points easily fits in. However, things are not as clear for distributions with an even number of data points. As such, here is how the median is found in both cases:
- For odd number distributions, the middle score of the distribution will be the median.
- For even number distributions, the median is equal to the sum of the 2 middle most scores divided by 2.
The advantages of using median include:
- Being unaffected by extreme values. The median does not take into account data values at the ends of the distribution. Instead, it solely focuses on the centre most value or values.
- Suitable for open ended distribution. Where one of the data points is for an open ended value e.g. “10 or more”, it is not possible to calculate the mean. However, since the median does not consider the end value, the average can still be found.
The disadvantages of using median include:
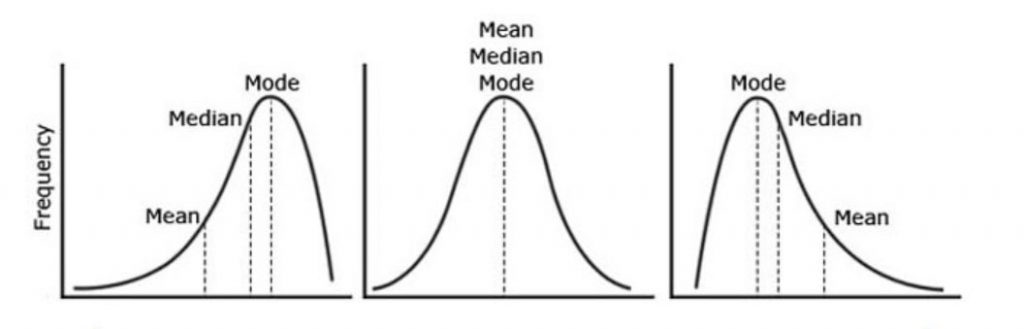
- Where a distribution is skewed, the median becomes ineffective. A skewed distribution involves having a majority of scores on one tail of the distribution while the minority is on the other end. As such, in finding the midpoint of the data set, you would not be finding a value that is representative of it.
Arithmetic Mean
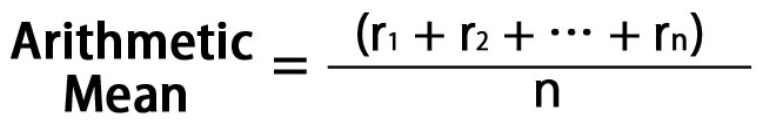
In mathematics, there are several forms of the mean such as the arithmetic, geometric and harmonic mean. We will be focusing on the arithmetic mean here which is often described as the “average”. The arithmetic mean is a highly popular statistic due to its simplicity and versatility.
In contrast to the median, the mean uses all values in the distribution. All data points are added up before dividing this sum by the number of data points. In doing so, an arithmetic average value is found whereby it is not a value that needs to be equal to any 1 data point.
The advantages of using mean include:
- Effective for both discrete and continuous data sets.
- Effective for skewed data sets since it takes into account all data values
The disadvantages of using mean include:
- Being influenced by extreme values. Where there are outlier values, the mean is strongly affected and becomes less representative of the main body of values.
Conclusion on the mean
All in all, the arithmetic mean is considered to be the most reliable measure of Central Tendency. Save for the situations listed above where median or more is more advantageous, you will often find that the mean is the most reliable representation of a distribution.
Einstein’s Takeaway:
Understanding the characteristics of a distribution and choosing the most appropriate measure of Central Tendency is critical for understanding and communicating about a data set. This is why so much emphasis is placed on this topic.
Furthermore, at further levels of academia or careers, the measures of central tendency are seldom used alone. Oftentimes, they used in tandem with the variance or standard deviation of a sample in order to further understand it or to plan a distribution.
Given its continual use and heavy usage in daily life, students should be familiar with the measures of Central Tendency as well as their applications. This is where sec 3 E math tuition and sec 3 A math tuition are valuable. Having the extra attention by qualified tutors will allow you or your child to fully grasp the measures of Central Tendency.
Contact Einstein Education Hub today to find out how we can help!